Sunday, August 24, 2014

Cash Flow Indicator Ratios: Dividend Payout Ratio


---------------------------------
Series : Ratio Analysis    (23 th Post)
-----------------------------------
Is the company paying good dividends ?
This ratio helps us to understand  the dividend paid by a company to its earnings,this relation between dividends and earnings is important since the remaining will be used for reinvestment and growth of the company.

Ideally Investors look for Divident Pay Out Ratio to be consistent or increasing over the years.

Formula: Dividend Pay Out Ratio:%= Dividends per common Share / Earnings Per share

Example : Go to http://www.moneycontrol.com/financials/hdfcbank/ratios/HDF01                         
  under the Tab “ Cash Flow Indicator Ratios ”


Next Post on Ratio Analysis:   Investment Valuation Ratios

-----------------------------------------------------------------------------------------------------
In my quest for learning value investing I came across Ratio Analysis & the importance of these ratios in analyzing a stock these ratios are easy to understand & give very good insights into a companies’ operations and its growth , would like to share this with the community
Comments  /  Improvements and points worth considering are welcome

Google Feed burner is free & allows to directly deliver any new post  on this blog to your email this is all for new bloggers .If you are interested  kindly enter your Email in the “Subscribe Via Email”   on the top left hand side of the navigation  menu’s.

Related Articles

·          Liquidity Measurement Ratios


Share |

Cash Flow Indicator Ratios: Cash Flow Coverage Ratio


----------------------------------
Series : Ratio Analysis    (22 th Post)         
-------------------------------

Is the company generating enough cash to meet its Liabilities & fund operating cost ?
This ratio helps us to understand  the ability of the company  Operating cash flow(Cash flow generated from main operations ) to meet its obligations which  includes Liabilities and to keep the business funded.
Ideally larger the ratio the better.

Formula: Short Term Debt Coverage: Operatinng Cash Flow/Short Term Debt
Capital Expenditure Coverage=Operating Cash Flow/ Capital Expenditure
Divident Coverage=Operating Cash flow/Cash Dividents


Next Post on Ratio Analysis:   Cash Flow Indicator Ratios: Dividend Payout Ratio
--------------------------------------------------------------------------------------------

In my quest for learning value investing I came across Ratio Analysis & the importance of these ratios in analyzing a stock these ratios are easy to understand & give very good insights into a companys operations and its growth , would like to share this with the community
Comments  /  Improvements and points worth considering are welcome

Google Feed burner is free & allows to directly deliver any new post  on this blog to your email this is all for new bloggers .If you are interested  kindly enter your Email in the “Subscribe Via Email”   on the top left hand side of the navigation  menu’s.

Related Articles

·          Liquidity Measurement Ratios
  
   Share |

Thursday, August 21, 2014

Cash Flow Indicator Ratios: Free Cash Flow/Operating Cash Flow Ratio


------------------------------------------------------------------------        
 Series : Ratio Analysis    (22 th Post)
---------------------------------------------

Is the company generating enough Free cash ?

This ratio helps us to understand  how much Free cash (Cash remaining after deducting Expenditure),the company is generating ,The Free Cash Flow/Operating Cash flow measure the relationship between Free cash & Operating Cash.

Free cash flow is defined as Operating Cash Flow minus the capital expenditures,This free cash is what a company use for expansion,acquisition,financial stability or to use this funds when the markets are not doing good.
The Higher the percentage of this Ratio the better the financial strength of the company.

Formula: FCF /OCF Ratio=Free Cash Flow(Operating Cash Flow- Capital Expenditure) / Operating Cash flow

Next Post on Ratio Analysis:   Cash Flow Indicator Ratios: Cash Flow Coverage Ratio
----------------------------------------------------------------------------------------------------------------------

In my quest for learning value investing I came across this interesting article and thought would like to share this with the community
Comments  /  Improvements and points worth considering are welcome

Google Feed burner is free & allows to directly deliver any new post  on this blog to your email .If you are interested  kindly enter your Email in the “Subscribe Via Email”   on the top left hand side of the navigation  menu’s.

Related Articles

·          Liquidity Measurement Ratios
   

 Share |

Cash Flow Indicator Ratios : Operating Cash Flow/Sales Ratio


------------------------------------------------------------------------          
Series : Ratio Analysis    (21 th Post)
-----------------------------------------

Is the company generating enough cash from its sales ?


This ratio helps us to understand the Cash being generated from sales or its ability to generate cash from its sales, usually expressed as a percentage.

The company’s sales growth should be in parallel with the Cash flow of the company if it’s not then there is change in terms of sale and Inefficient or ineffective management.

A high number means the firm will be able to grow because it has sufficient cash flow to finance additional production, a low number indicates the opposite.

The statement of cash flows has three distinct sections, each of which relates to an aspect of a company's cash flow activities - operations, investing and financing. In this ratio, we use the figure for operating cash flow

Formula: Operating cash flow / Sales Ratio = Operating Cash Flows / Sales Revenue


Next Post on Ratio Analysis:   Cash Flow Indicator Ratios: Free Cash Flow/Operating Cash Flow Ratio

--------------------------------------------------------------------------------------------------------

In my quest for learning value investing I came across this interesting article and thought would like to share this with the community
Comments  /  Improvements and points worth considering are welcome

Google Feed burner is free & allows to directly deliver any new post  on this blog to your email .If you are interested  kindly enter your Email in the “Subscribe Via Email”   on the top left hand side of the navigation  menu’s.

Related Articles

·          Liquidity Measurement Ratios
  
Share |

Tuesday, August 12, 2014

Cash Flow Indicator Ratios


-----------------------------------
Series : Ratio Analysis    (20 th Post)

-----------------------------------


Q How solvent, liquid, and viable the company is ? 


This ratio helps us to understand the Cash being generated how much is generated These ratios can give users another look at the financial health and performance of a company.

Cash inflows usually arise from one of three activities – financing, operations or investing .In accounting using non cash based transactions companies that appear to be profitable are actually at a financial risk if they are generating little cash ,

Example if a company does lots of sales on credit they will look profitable but they are yet to receive the cash from the sale’s. Using this Ratios helps to highlight this Details about a company's performance.

This ratio uses cash flow along with other key metrics to determine how much cash the company is generating from the sales ,the Cash generated is free and clear and ready to meet company's  obligations.

The Cash flow Ratios that will be defined in following posts are

1.Operating Cash Flow/ Sales Ratio
2.Free Cash Flow/ Operating Cash Flow Ratio
3 Cash Flow Coverage Ratio


Next Post on Ratio Analysis:   Cash Flow Indicator Ratios : Operating Cash Flow/Sales Ratio
---------------------------------------------------------------------


In my quest for learning value investing I came acrros this interesting article and thought would like to share this with the community
Comments  / Improvements and points worth considering are welcome

Google Feedburner is free & allows to directly deliver any new post  on this blog to your email .If you are interested  kindly enter your Email in the “Subscribe Via Email”   on the top left hand side of the navigation  menu’s.


Related Articles


·          Liquidity Measurement Ratios


Share |

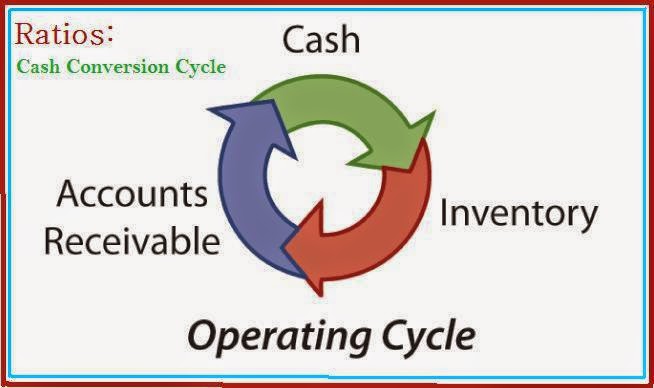
Operating Performance Ratios : Cash Conversion Cycle ( Operating Cycle )

  
----------------------------------------------------
Series : Ratio Analysis    (19 th Post)
---------------------------------------------------


 Q Is the company generating enough cash on time , from the sales of  its inventory ?


This Cash Conversion Cycle or Operating Cycle is an indicator in number of days a company takes to receive its cash from the accounts receivable from the time purchase of its inventory.
Less Number of days means more Cash is available quickly for additional purchases or repayment of its loans.

Formula: Operating Cycle Days or Cash Conversion Cycle (CCC) =  DIO + DSO – DPO
                          DIO=Days Inventory Outstanding
                          DSO=Days Sales Outstanding
                          DPO=Days Payable Outstanding

DIO is calculated as :

1.    Dividing the cost of sales (income statement) by 365 to get a cost of sales per day figure;
2.    Calculating the average inventory figure by adding the year's beginning (previous yearend amount) and ending inventory figure (both are in the balance sheet) and dividing by 2 to obtain an average amount of inventory for any given year; and
3.   Dividing the average inventory figure by the cost of sales per day figure.

DSO is calculated as :
  1. Dividing net sales (income statement) by 365 to get net sales per day figure;
  2. Calculating the average accounts receivable figure by adding the year's beginning (previous yearend amount) and ending accounts receivable amount (both figures are in the balance sheet) and dividing by 2 to obtain an average amount of accounts receivable for any given year; and
  3. Dividing the average accounts receivable figure by the net sales per day figure.
DPO is calculated as :
  1. Dividing the cost of sales (income statement) by 365 to get a cost of sales per day figure;
  2. Calculating the average accounts payable figure by adding the year's beginning (previous yearend amount) and ending accounts payable amount (both figures are in the balance sheet), and dividing by 2 to get an average accounts payable amount for any given year; and
Dividing the average accounts payable figure by the cost of sales per day figure.


Next Post on Ratio Analysis:   Cash Flow Indicator Ratios 

------------------------------------------------------------------------- 


In my quest for learning value investing I came acrros this interesting article and thought would like to share this with the community
Comments  / Improvements and points worth considering are welcome

Google Feedburner is free & allows to directly deliver any new post  on this blog to your email .If you are interested  kindly enter your Email in the “Subscribe Via Email”   on the top left hand side of the navigation  menu’s.

Related Articles

·          Liquidity Measurement Ratios


Share |